Smart Marker Report Query Definition Tab
You must be a Project Center administrator to create custom reports.
This topic contains the following sections:
● Querying, grouping, and sorting report data
● Group by reports - punchlists and project teams
● Specifying image size and resolution
● Document Control Activity Center
Introduction
Using Aspose Smart Markers, you can add a worksheet tab called Query Definition (shown below) to your Microsoft Excel report template spreadsheets to specify how to display data in your customized reports. Using pre-defined tags/keywords, you can specify values for sorting, grouping, photo size, and image resolution.

Querying, grouping, and sorting report data
When running a report from Project Center, the items are added to the report dataset in the order they are displayed in the activity center.
If you would prefer to display items in a different order for a particular report, you can specify different criteria in the Query Definition worksheet (tab).

<group> - Specify the column by which you want to group the report data. For example, if you are reporting on submittals and would like to group the report by Status so that all closed items appear one after the other, all open items appear one after the other, etc., you would specify Status as the fieldname.
<sort query table> - Indicates the beginning of the table that you can use to specify sort criteria. You can specify multiple sort criteria.
<fieldname> - Specify the column name to sort by. Continuing with the example above, you could group by Status and then also sort by Status in ascending order so that the closed items appear first, then draft items, then open items. You can also use the sort query table without specifying a group column. You can specify multiple columns to sort by.
<direction> - The direction of the sort (valid values are ASC or DESC).
</sort query table> - Indicates the end of the table used to specify sort criteria.
<filter query table> - Indicates the beginning of the table used to specify filter criteria. You can specify multiple filter criteria.
<fieldname> - Specify the column name to filter. Continuing with the example above, you could group by Status and then also filter the report to display only draft and closed items by adding a filter item to the table with the fieldname equal to Status, operator equal to =, and value to Draft, with the combine operator set to And. You could then add another filter item to the table with fieldname equal to Status, operator equal to =, and value to Closed.
<operator> - Like, =, <>, >=, <=
<value> - Text to compare the fieldname value to.
<direction> - The direction of the sort (valid values are: ASC or DESC).
<combine operator> - And, Or.
</filter query table> - Indicates the end of the table used to specify filter criteria.
Default dataset filter
You can set a pre-defined dataset filter for a report:

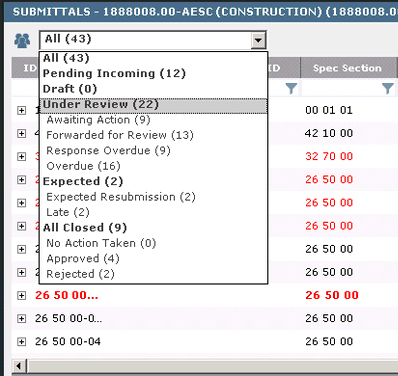
The report will be run for the data that matches the filter if the tag and a valid value are included in the template. For example, if you are in the Submittals Activity Center and are viewing All submittals, but run a report with a template that has the <default dataset filter> set to Under Review, then only those submittals that are under review will be included in the report. The values are dependent on the activity center and match the category filter names in the category drop-down list. The following example shows the valid filter values for submittals:
Group by reports - punchlists and project teams
You can group some reports so that each group contains its own header information.
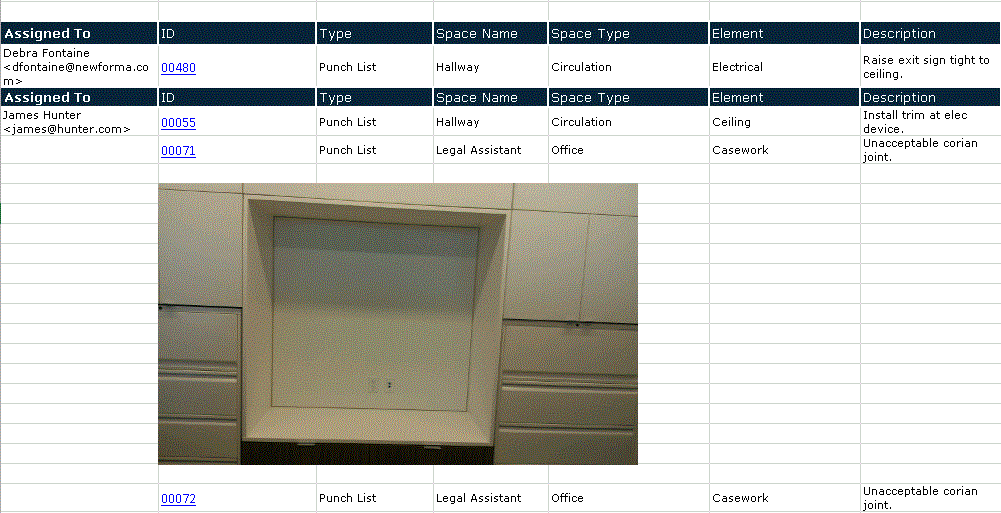
You can group punchlist reports by Space Name or Assigned To. To group your punchlist report by one of these two columns, add the <group data by column> tag to your report and then specify either Space Number or Assigned To, as shown here. Your report will then be grouped by the appropriate field.

The following report was generated by specifying Assigned To as the <group data by column> value.
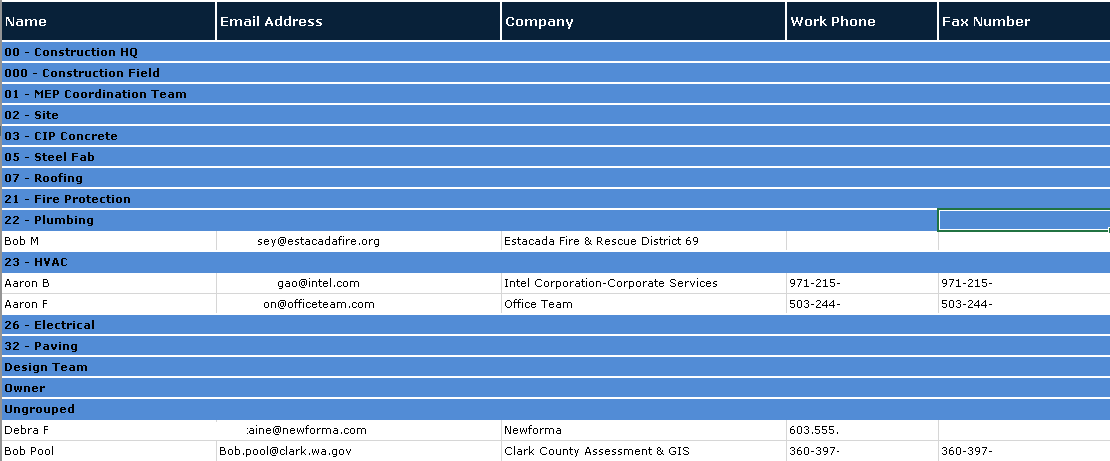
You can group project team reports by the project team group:

You would specify Group as the value for the <group data by column> value. You can also specify a name for the un-grouped project team member's header. The following report was generated with Ungrouped as the value for <ungrouped header name>.
Specifying image size and resolution
Reports generated from the Punch List Activity Center and Field Notes Activity Center can include in-line images. You can specify the number of images per row, image size, and resolution in the Query Definition worksheet:

<images per row> - Number of images to display horizontally per row (default: 4).
<image size> - Small (2 inches wide at selected resolution); Medium (3 inches wide at selected resolution); Large (5 inches wide at selected resolution). Default: Medium.
<image resolution> - Screen (96 dpi); Print (150 dpi); High Quality Print (300 dpi). Default :Screen.
You must specify at least one of the fields above in order for images to be inserted into the report.
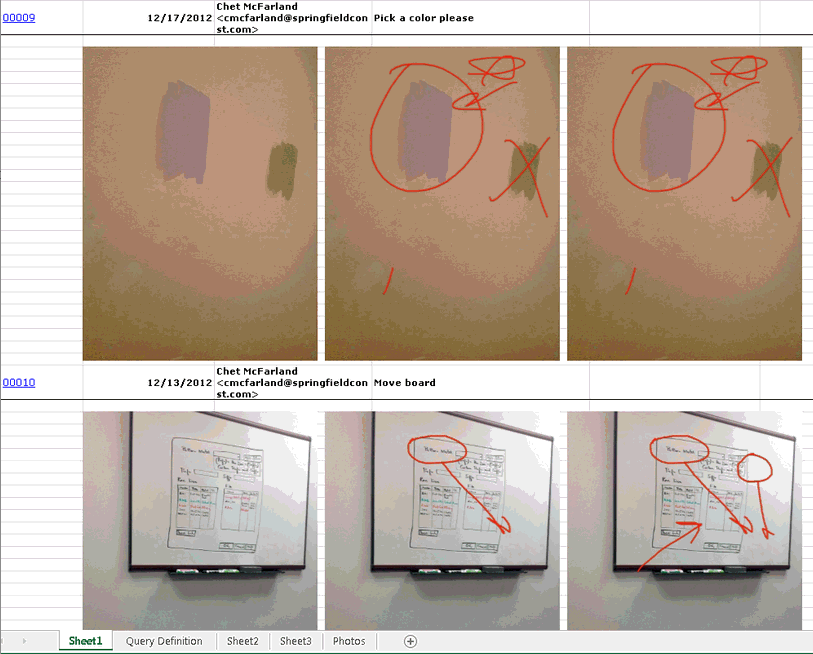
In the following field notes report, the <images per row> value was set to 4, the <image size> set to Medium, and the <image resolution> set to Print. Therefore, in each row, up to four images will be displayed. If there are more than four images, the remaining images will be placed in subsequent rows. The images are three inches across at a resolution of 150 dpi.
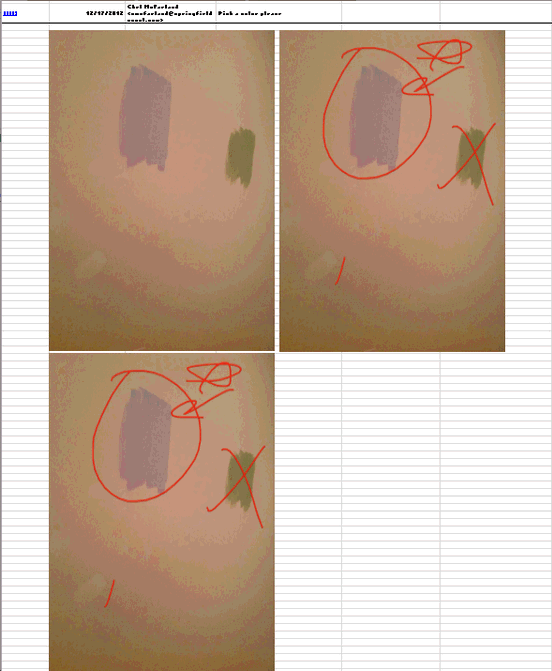
In the following example, the report was generated with the <images per row value> set to 2 and the <image size> set to Large.
Specifying image borders
You can add borders around images by using the <image border> tag to specify a width for the border and <image border color> for the border color:

<image border> - An integer value specifying border thickness.
<image border color> - A string representing the border color (known pre-defined Windows system colors). Click the following link for valid colors:
http://msdn.microsoft.com/en-us/library/system.drawing.knowncolor(v=vs.110).aspx
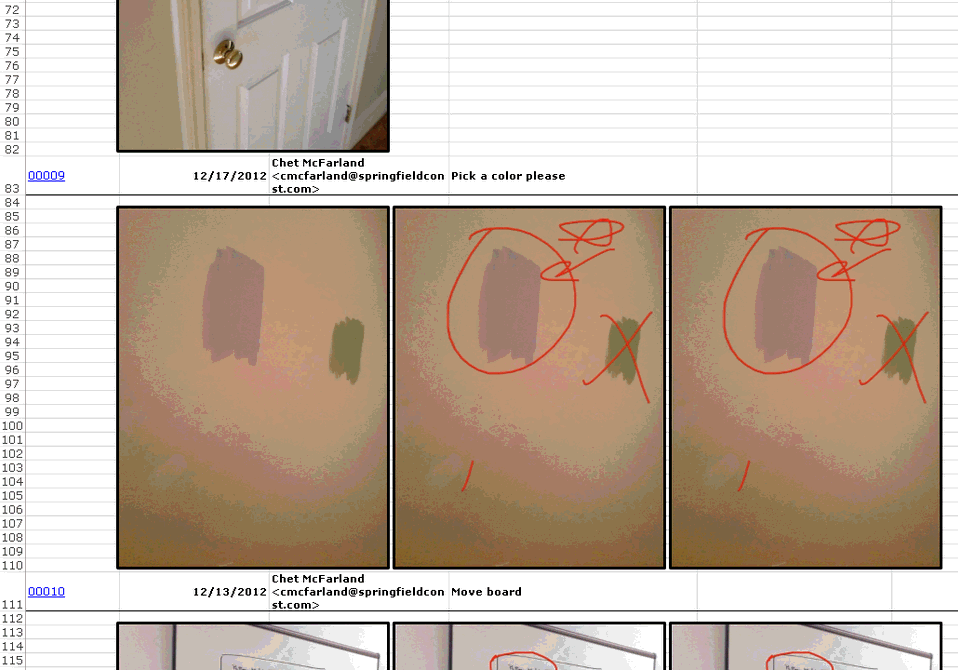
The following report specified 2 for the <image border> and Black for the <image border color>:
Including EDMS properties
Some reports will display extended properties for files from EDMS systems such as FileNet or ProjectWise. Custom reports generated from the Document Control Activity Center or activity centers that include workflow can display EDMS properties for documents if the value for the <include edms document properties> tag is set to True:

Workflow activity centers and transmittal activity centers
For the Project Transmittal Activity Center or activity centers that include workflow (contract management activity centers), the extended properties are available as part of the description of contents. To include extended properties, you must set the <include edms document properties> tag value to True and include valid EDMS property Smart Markers in a custom template. The EDMS extended properties are not displayed in the standard log report - you must use a custom template to display them in a report.
For example, if you want to display the Document Description, Client Name, Division Code, and Division Name, you would add the following Smart Markers to your template.

All EDMS properties are stored in the dataset with a doc_ prefix in order to eliminate possible duplication with existing Project Center column names.
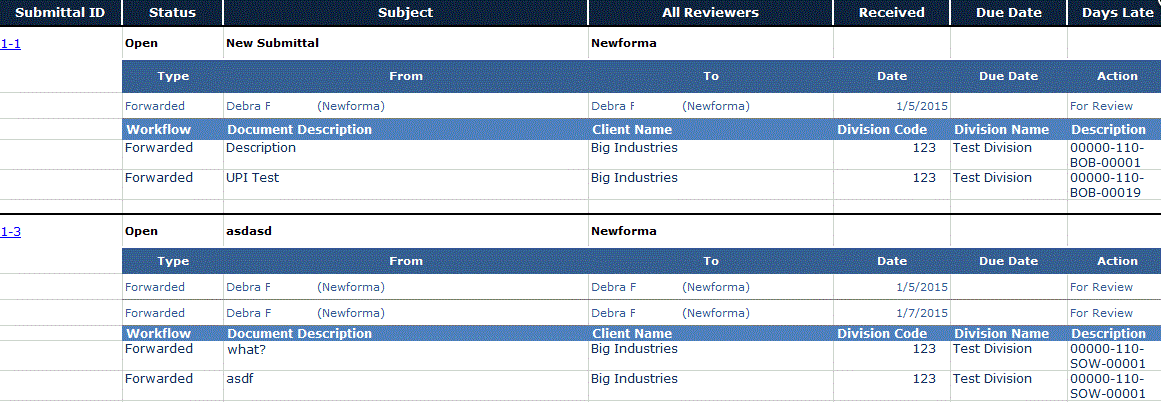
The generated report would then include those properties for each content descriptor row:
Document Control Activity Center
Custom log report
Continuing from the previous section, you can include EDMS properties in a custom log report in the Document Control Activity Center by setting the <include edms document properties> tag to True in the custom template and adding Smart Markers that reference EDMS properties to the template.

All EDMS file properties are prefixed with doc_ to avoid duplication of existing Project Center column names.
Document Register Report
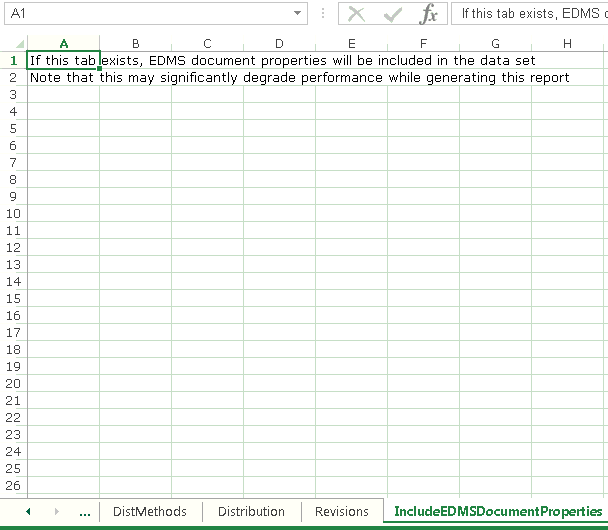
To include extended properties in the document register report, you need to add a new worksheet to your template and name it IncludeEDMSDocumentProperties:
You can then include Smart Markers that reference the EDMS properties:

Again, all EDMS properties are prefixed with doc_ in order to avoid field duplication with other existing Project Center columns or field names.
Table of Contents
Index
Search (English only)
Back


