Reports Overview
Standard report log templates
Project Center comes with a default report template named standardreport.xlsx. It is located on the Project Center Server machine under Templates\2022 Edition. Use this report to summarize and communicate project information, as well as to record project information at a point in time. You can generate a log report from each activity center. The information that appears in each standard report is based exactly on the layout of the activity center log view from which you generated the report.
Specialized report templates
Specialized report templates are Microsoft Excel files (they can also, in some instances, be Word files) that contain column labels and Smart Marker calls to query the Project Center database to fill in the desired project information in your generated specialized reports. With these templates, you can specify the exact column layout as well as leverage Excel formulas to perform special processing functions. For example, you could set up a column to calculate the days late for some or all of your submittals.
Use these reports to control your generated transmittals for areas such as the project team, the action items log, submittals, RFIs, and general layouts from the log views. Since they're based on Microsoft Excel, you can customize them using any of the Excel formatting components to make your reports look the way you want them to for your branding and layout needs. Understanding your company's workflow processes is essential to understanding which reports you want to customize.
Using reports
View and generate reports
See Generate a Standard Activity Center Log Report or Create a Multi-Project Report.
Generate report specialized for contracts or RFIs
See Generate a Specialized Contract or RFI Report.
Configure the appearance of reports
Use a different report template in a project or activity center
See Apply a New Report Template Style to a Project or Activity Center.
Select a custom template for a multi-project report
See Select a Custom Template for a Multi-Project Report.
Custom report templates
Project Center allows you to create and use custom report templates for each activity center. To do this, the person creating the custom report templates must have an advanced knowledge of Microsoft Excel and know how to use Aspose Smart Markers. See https://docs.aspose.com/cells/net/using-smart-markers/ for more information about Smart Markers.
Use Aspose Smart Markers
You can insert Aspose Smart Markers in an Excel spreadsheet that contains visual formatting styles and formulas. Smart Markers reference data sources that can be merged into the spreadsheet programmatically. Smart Markers make report templates easier to customize and provide automatic filling of formulas and subtotals in a spreadsheet.
Customize Excel-based specialized reports with Smart Markers
Open Customizing Excel-Based Specialized Reports with Smart Markers and refer to the following two Excel files: Specialized Report Template - Log with Details and Specialized Report Template - Log Only.
Smart Marker field reference guides for creating custom reports in each activity center
Smart Marker reference guides for creating custom reports are available for most activity centers. See Smart Marker Field Reference Guides for Creating Custom Reports in Each Activity Center for a list of Microsoft Excel custom report spreadsheets containing available Smart Marker fields.
Use your own custom report templates in activity centers
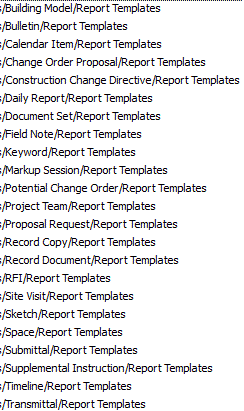
A folder called Report Templates
is automatically added to all activity center folders on the Project
Center Server under Templates\2022
Edition, as shown in the example below. A readme.txt file explaining how
to add your custom report
templates to the folder has been added to each folder. After you create
your custom reports, you can Configure
Project Center to Use Specialized Report Templates in Activity Centers.
After doing so, you can access the new report templates by opening the
appropriate activity center and clicking the Create
a Report task to open the Create
Report dialog box. The new template will be listed in the Specialized
Report drop-down list.

Query Definition tab in specialized reports
You can add a Query Definition to your Microsoft Excel spreadsheet report templates. See Smart Marker Report Query Definition Tab in addition to the following information:
|
|
The Query Definition tab is a worksheet contained within a Project Center specialized report. This worksheet defines static grouping, sorting, and filtering criteria. This criteria is applied to the log view data present when the report is generated. 1. Grouping 2. Sorting 3. Filtering
|
Grouping

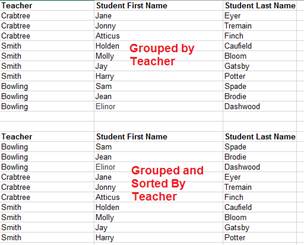
You can group the report on any column. Enter the name of the column in the column B adjacent <group>.
Grouping brings together items in the specified column based on the order data is returned from Project Center. It is recommended that the field specified in <group> is also specified as the first <sort query table> entry.
Sorting
 The <sort
query table> contains a list of columns <fieldname>s
to sort on and the direction in which to sort. Sort <direction>
can be either ASC (ascending)
or DESC (descending).
The sort list will be applied in the sequence entered. In the example shown here, the data set is first ordered by Submittal ID and then by Status.
Filtering

Filtering allows static filtering criteria to be embedded in the report.
<fieldname> Column to filter on.
<operator> Filter operator. Valid arguments are:
= Equal to <value>
Like Search for <value>
<> Not Equal to <value>
> Greater than <value>
< Less than <value>
>= Greater than or equal to <value>
<= Less than or equal to <value>
<value> Value filtering for based on operator.
<combine operation> For the second and subsequent filter criteria:
And Filter criteria is cumulative
Or Filter results are cumulative
Table of Contents
Index
Search (English only)
Back


